Stencils tagged with ‘charts’
Cool Flowchart Symbols 2.0
The new Cool Flowchart Symbols Version 2 stencil makes software process flowcharts beautiful. It features elegant symbol designs for processes, hardware, and popular document types. Version 2 adds new database, document types, and Sprint process symbols. I created this stencil because I wanted to create beautiful process...more
Charts & Graphs
Charts and Graphs for User experience and wireframe designing
Charts and Graphs - Grayscale
A beautiful Omnigraffle stencil with a set of charts and graphs in grayscale, ideal for data visualization, designed specifically for wireframing. This set includes a variety of line charts, area charts, stacked bar charts, bar charts, pie charts and gauges. Perfect for wireframing anything from dashboards to analytic...more
Gorgeous Charts and Graphs
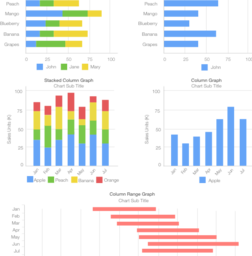
A full set of charts and graphics for data visualization in a bold, beautiful, and gorgeous color palette. Included are bar charts, stacked bar charts, line charts, calendar views, bullet charts, pie charts, sparklines, bubble graphs, difference charts, area charts, gauges, a sankey diagram, funnel graph, scatter plot, stream...more
Business Charts and Graphs
A full set of charts and graphics for data visualization in a subdued and professional color palette ideal for business. Included are bar charts, stacked bar charts, line charts, calendar views, bullet charts, pie charts, sparklines, bubble graphs, difference charts, area charts, gauges, a sankey diagram, funnel graph,...more
Grayscale Charts and Graphs
A full set of charts and graphics for data visualization in a grayscale color palette for wireframing. Included are bar charts, stacked bar charts, line charts, calendar views, bullet charts, pie charts, sparklines, bubble graphs, difference charts, area charts, gauges, a sankey diagram, funnel graph, scatter plot, stream...more
Statecharts
Statechart stencil from Other Inbox's statechart template
Charts for storyboarding v1.2
A different set of charts and a table which can be used to create a storyboard or workflow for a dashboard
Charts for storyboarding
A different set of charts and a table which can be used to create a storyboard or workflow for a dashboard


