Stencils tagged with ‘data’

Data Flow Diagram (DFD)
This stencil can be used to draw a Data Flow Diagram

File Icons
Vector icons for common file extensions: - Text Files - Data Files - Audio Files - Video Files - Image Files - Compressed Files - Other Files Each group has an additional generic icon to be used and/or customized in case of extensions not included within the stencil. This work is licensed under the Creative Commons...more

Charts and Graphs - Grayscale
A beautiful Omnigraffle stencil with a set of charts and graphs in grayscale, ideal for data visualization, designed specifically for wireframing. This set includes a variety of line charts, area charts, stacked bar charts, bar charts, pie charts and gauges. Perfect for wireframing anything from dashboards to analytic...more

Gorgeous Charts and Graphs
A full set of charts and graphics for data visualization in a bold, beautiful, and gorgeous color palette. Included are bar charts, stacked bar charts, line charts, calendar views, bullet charts, pie charts, sparklines, bubble graphs, difference charts, area charts, gauges, a sankey diagram, funnel graph, scatter plot, stream...more

Business Charts and Graphs
A full set of charts and graphics for data visualization in a subdued and professional color palette ideal for business. Included are bar charts, stacked bar charts, line charts, calendar views, bullet charts, pie charts, sparklines, bubble graphs, difference charts, area charts, gauges, a sankey diagram, funnel graph,...more

Grayscale Charts and Graphs
A full set of charts and graphics for data visualization in a grayscale color palette for wireframing. Included are bar charts, stacked bar charts, line charts, calendar views, bullet charts, pie charts, sparklines, bubble graphs, difference charts, area charts, gauges, a sankey diagram, funnel graph, scatter plot, stream...more

Splunk Documentation Icons
This stencil is based on the Splunk Style guide and the stencil is provided on the Splunk WIKI http://wiki.splunk.com/images/e/e0/Splunk-Icon-Styleguide.pdf

Entity Relationship
Entity Relationship models for design database diagrams.
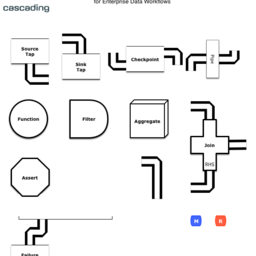
Cascading
This stencil can be used to illustrate "conceptual flow diagrams" as shown in the O'Reilly book "Enterprise Data Workflows with Cascading" by Paco Nathan.