Stencils tagged with ‘g’
Cascading
This stencil can be used to illustrate "conceptual flow diagrams" as shown in the O'Reilly book "Enterprise Data Workflows with Cascading" by Paco Nathan.
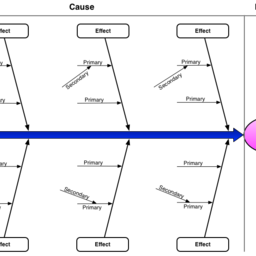
Cause and Effect - Fishbone Diagram
This is a ready-made Fishbone, or Ishikawa, diagram to get you started on your Cause and Effect analysis. The whole diagram is made as a group for easy drag-and-drop between the stencil and your canvas. Before starting to work on your Fishbone diagram, you should ungroup the compound shape. The primary and secondary causes...more
Cell Surface Receptors
These are surface receptors that I use for diagrams
Cellular Components and Proteins
This is a collection of symbols for diverse proteins. It includes transmembrane proteins, transcription factors, kinases and enzymes as well as a representation of the nucleus and the mitochondrium. If you use this stencil for a publication, it would be kind to acknowledge the source (see website below).
Charts and Graphs - Grayscale
A beautiful Omnigraffle stencil with a set of charts and graphs in grayscale, ideal for data visualization, designed specifically for wireframing. This set includes a variety of line charts, area charts, stacked bar charts, bar charts, pie charts and gauges. Perfect for wireframing anything from dashboards to analytic...more
Charts and Tables
Charts and tables stencil from the Design Stencil kit in the Yahoo! Design Pattern Library.
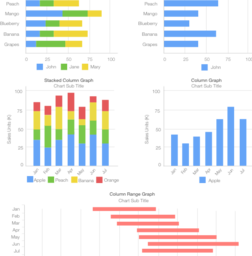
Charts & Graphs
Charts and Graphs for User experience and wireframe designing
Chatbot Robots
Chatbots are coming and we must be prepared! This is the ultimate stencil for designing chatbots. It includes everything you need to design your own chatbot for desktop or mobile apps. What’s a chatbot? It’s an automated agent that can respond to simple chat commands. Chatbots are often used for customer service in mobile...more
Checkout
Essential elements of shopping cart design.


