Stencils matching ‘data’

AWS Simple Icons: Database
AWS Simple Icons are an official icon set that includes icons for several AWS products and resources. Customers and partners are permitted by AWS to use them to create architecture diagrams. The icons are designed to be simple so that you can easily incorporate them in your diagrams and put them in your whitepapers,...more

AWS Simple Icons: Groups
AWS Simple Icons are an official icon set that includes icons for several AWS products and resources. Customers and partners are permitted by AWS to use them to create architecture diagrams. The icons are designed to be simple so that you can easily incorporate them in your diagrams and put them in your whitepapers,...more

AWS Simple Icons: Monitoring
AWS Simple Icons are an official icon set that includes icons for several AWS products and resources. Customers and partners are permitted by AWS to use them to create architecture diagrams. The icons are designed to be simple so that you can easily incorporate them in your diagrams and put them in your whitepapers,...more

Box-and-Arrow Diagrams
The classic elements of box-and-arrow diagrams, widely used in describing Lisp data structures constructed from cons cells.

Business Charts and Graphs
A full set of charts and graphics for data visualization in a subdued and professional color palette ideal for business. Included are bar charts, stacked bar charts, line charts, calendar views, bullet charts, pie charts, sparklines, bubble graphs, difference charts, area charts, gauges, a sankey diagram, funnel graph,...more
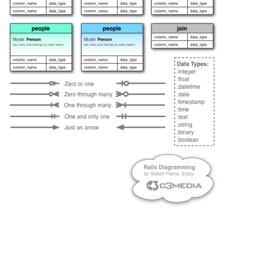
C3 Rails Diagramming
Some helpful stencils for designing your database and models. Sort of an Entity Relationship Diagram (ERD) with some added stuff that helps me think through what's going to go on when I get to coding. Don't feel bad if (like me) you are more of a Designer/Developer and just use the plain arrow to connect things. The ERD stuff...more
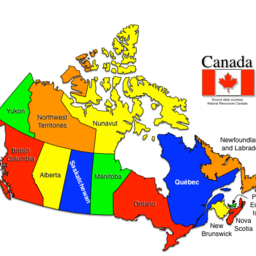
Canadian Map
This stencil has been created at the same scale as our "States of the USA" stencil, using Natural Resources Canada data.
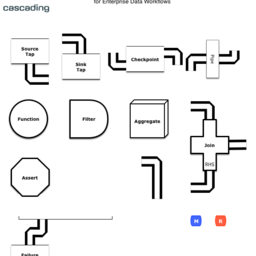
Cascading
This stencil can be used to illustrate "conceptual flow diagrams" as shown in the O'Reilly book "Enterprise Data Workflows with Cascading" by Paco Nathan.

Charts and Graphs Bundle
A full set of charts and graphics for data visualization in three color palettes: gorgeous, business, and grayscale. Included are bar charts, stacked bar charts, line charts, calendar views, bullet charts, pie charts, sparklines, bubble graphs, difference charts, area charts, gauges, a sankey diagram, funnel graph, scatter...more