Stencils tagged with ‘it’

Balanced Scorecard (BSC)
The balanced scorecard (BSC) is a strategic performance management tool - a semi-standard structured report supported by proven design methods and automation tools that can be used by managers to keep track of the execution of activities by staff within their control and monitor the consequences arising from these actions....more

DTM-Electronic Music Studio Gear
Basic digital home music studio gear, including a synthesizer, portable sequencer, mixer/recorder, laptop computer and USB-MIDI interface. Drawn in basic grayscale for easy repurposing and recoloring.

Clavister Security Gateway Series
This stencil contains a collection of Clavister Security Gateways for designing security network layouts.

Electronics Components
This stencil of circuit components includes equipment and novel components found in a physics lab. Documenting experimental setups in this way has been quite successful. I appreciate the circuit aesthetics of the "Microelectronics" textbook by Sedra and Smith, as well as the visual dictionary of components common in SPICE...more

Content Flow Diagram
Define, design and document dynamic content systems and content strategies using this modelling technique.

Felt pen flow chart symbols
Version 1.0 of a felt pen flow chart stencil. Get the White Board feeling of your flow charts in OmniGraffle ;-)

Arista Networks 7000 Product Stencils
Arista Networks Product Icons. Front panel elevations of each of the Arista 7000 Family of Data Center Switches. Arista 7048T-A - 48 GbE + 4 10GbE Arista 7050S-64 - 48 10GbE SFP+ + 16x10GbE/4x40GbE SFP+/QSFP Arista 7050S-52 - 52 10GbE SFP+ Arista 7050T-64 - 48 100/1G/10Gb BASE-T + 16x10GbE/4x40GbE SFP+/QSFP Arista 7050T-52 -...more
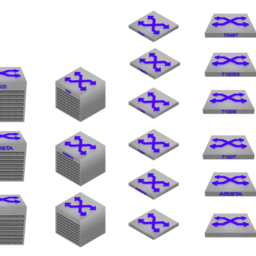
Arista Networks 7000 Family Icons
Arista icons for the Arista 7000 Family of 10Gb switches including the Arista 7500 Series modular switches, Arista 7100 Series of rack switches, and the Arista 7048 gigabit switch.
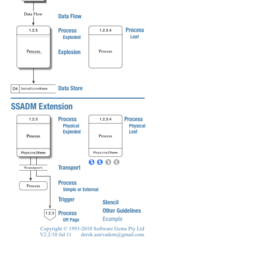
Data Flow Diagram (SSADM)
The classic Structured Systems Analysis and Design Methodology by Chris Gane and Trish Sarson. SSADM is better known as Data Flow Diagrams. It is a simple and highly effective systems analysis and design (decomposition) methodology. It uses just four symbols, and it is excellent for communicating with non-technical users. A...more