7 stencils favorited show all
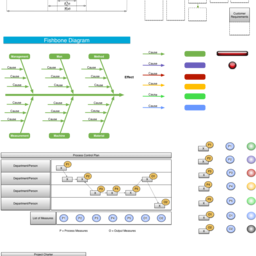
Lean Six Sigma Tools
Continuous Process Improvement (CPI) tools for integrating into quality plans to include Define, Measure, Analyze, Improve, and Control (DMAIC) scientific model. Includes Bell Shaped Curve for plotting, Project Charter Matrix, Fishbone Diagram showing root causes, SIPOC Chart and Process Control Plan. Soon to come: Weighted...more
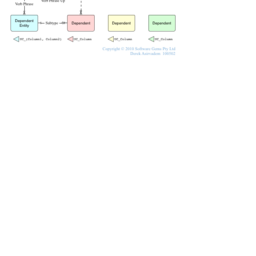
Entity Relation Diagram (ERD)
Allows you to draw simple Entity Relation Diagrams (the first page). ERDs are useful in the early stages of a project, especially if you are using formal approach such as Structured Systems Analysis and Design Methodology (for which there is a SSADM stencil) or IDEF0. I have added an extension, which allows indices to be...more

TRAK
Version 13 - 1st Feb 2018. Provides a set of blocks and connectors to enable architecture description views to be produced using the open source TRAK enterprise architecture framework. The TRAK Metamodel defines the objects and how they connect together. The sets of objects allowed in each TRAK view are defined by TRAK...more
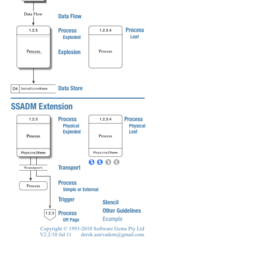
Data Flow Diagram (SSADM)
The classic Structured Systems Analysis and Design Methodology by Chris Gane and Trish Sarson. SSADM is better known as Data Flow Diagrams. It is a simple and highly effective systems analysis and design (decomposition) methodology. It uses just four symbols, and it is excellent for communicating with non-technical users. A...more

SGI icons
Some SGI icons, imported from MaXX Interactive Desktop source SVGs at http://dev.maxxdesktop.com/trac/maxxdesktop/browser